Percent Checked Out Location Heat Map
CLICK THE BLUE PATH LINK TO RUN THE REPORT: Custom > ~Tech Services > Percent Checked Out Location Heat Map
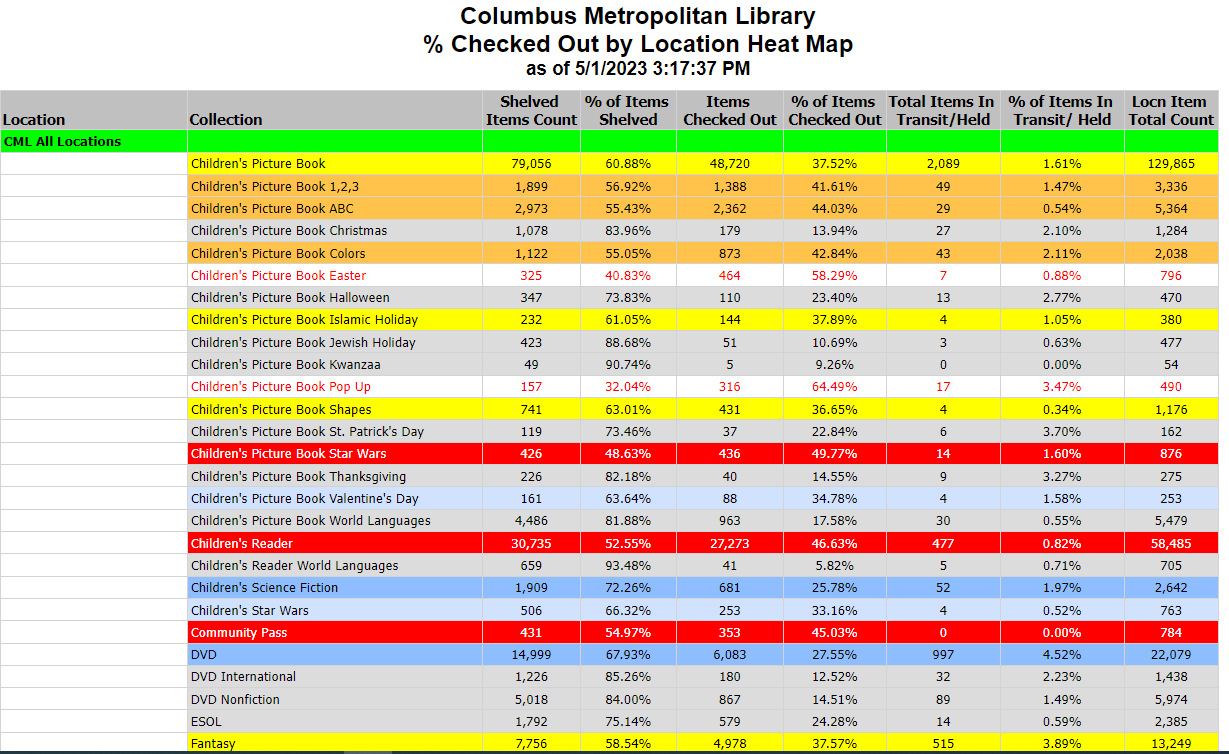
This is a copy of a CML report (thanks Susan!) that’s been adapted for use by other CLC members. Displays the collection utilization statistics using a colorized heat map to show which collections are hot or cold and a few categories in between. The report contains both total library level stats and for each individual branch. The first page of the report is the color code legend and the data itself begins on page two.
All collection codes that have been enabled for the branch will be shown in the report. To eliminate “zero” rows, please open a HelpDesk request and ask CLC to disable that collection code.
keywords for searching: heatmap